Translate this page into:
Effect of Stress Maneuvers at the Ankle Joint on Peak Systolic Velocity and Waveforms in Popliteal and Posterior Tibial Arteries in Healthy Individuals

Corresponding Author: Shyamkumar N Keshava, Department of Radiology, Christian Medical College Hospital, Vellore - 632 004, Tamil Nadu, India. E-mail: aparna_shyam@cmcvellore.ac.in
-
Received: ,
Accepted: ,
How to cite this article: George S, Yadav VK, Keshava SN, Agarwal S. Effect of Stress Maneuvers at the Ankle Joint on Peak Systolic Velocity and Waveforms in Popliteal and Posterior Tibial Arteries in Healthy Individuals. Am J Interv Radiol 2018, 2(6) 1-6.
Abstract
Purpose:
The purpose of this study was to study the effects of ankle position on Doppler measurements of popliteal artery (PA) and posterior tibial arteries (PTA) in healthy individuals.
Materials and Methods:
PA and PTAs of 20 healthy (questionnaire based and ankle brachial pressure index assessed) subjects (40 limbs) were studied with Doppler ultrasound in neutral and after active ankle joint movements.
Results:
The mean increase in the velocity of PA from neutral position was more with plantar flexion as compared to dorsiflexion (22 vs. 15 cm/s, respectively). PA showed a significant change in waveform, with the absence of diastolic flow, more with dorsiflexion than plantar flexion (46% and 33%, respectively). Similarly, mean increase in the velocity of PTA was more with plantar flexion as compared to dorsiflexion (mean 36.7 vs. 33.2 cm/s, respectively). PTA showed a significant change from triphasic to biphasic and monophasic on plantar flexion (up to 39.2%). Dorsiflexion also showed similar results, however, to a lesser degree. None of the PA or PTA showed complete absence of flow on these maneuvers.
Conclusion:
Predominantly, a pattern of increase is seen in the mean velocity on plantar flexion and dorsiflexion in both the arteries. The most common change in the Doppler waveforms was the absence of diastolic flow (biphasic pattern). Our study confirms that waveforms in the popliteal and PTA can even be monophasic depending on the position of the foot in normal healthy individuals, therefore, when biphasic/monophasic in appearance, they should not be interpreted as abnormal or diseased.
Keywords
Doppler
Lower limb arteries
Stress maneuvers
Velocities
Waveforms

INTRODUCTION
Provocative maneuvers at the ankle joint are known to cause changes in the blood flow in the popliteal and the posterior tibial arteries (PTAs).[1] These changes become relevant as aid in diagnosis, especially in cases of popliteal artery entrapment (PAE) syndrome. PAE is an anomalous anatomic relation between popliteal artery (PA) and the surrounding gastrocnemius muscle which may occur during embryonic development.[2] Sonographic examination can show arterial compression elicited by maneuvers such as plantar flexion and dorsiflexion of the feet.[3] During active dorsiflexion and plantar flexion, the contracted gastrocnemius muscle can cause compression and stretching of the entrapped PA with loss of pulse at the ankle which can be picked up on Doppler ultrasonography in PAE.[4] However, it is not a specific finding and may be found in up to 53% of normal subjects.[5] Loss of pulse is a subjective finding, and there are limited studies in healthy individuals, which measure the magnitude of change in velocity and waveform. The aim of our study was to find this change in velocity and waveform with ankle movements in healthy individuals.
Objectives of the study
To study the effect of dorsiflexion and plantar flexion at the ankle joint on popliteal and PTA flow velocity and Doppler waveforms in healthy individuals.
MATERIALS AND METHODS
It was an observational study done over 8 months. The study was approved by the institutional review board. Informed consent was obtained from all the study participants. The study participants were selected after they were screened with a questionnaire (Table 1) and objective assessment was done using ankle brachial pressure index (ABPI) (Table 2). Subjects answering “Yes” to any of the questions or with ABPI <1 were excluded from the study.
| Q.1 | Any history of pain in the legs at rest/on walking short distances? |
| Q.2 | Any history of loss of sensation/abnormal sensations in the legs? |
| Q.3 | Any history of skin changes over the legs? |
| Q.4 | Any history of chest pain at rest/on exertion? |
| Q.5 | Any history of hypertension/diabetes? |
| Q.6 | Any history of heart disease/blood disorder? |
| Q.7 | Any history of malignancy? |
| Q.8 | Any family history of any of the above diseases? |
| Q.9 | Any history of smoking? |
| Severity of disease | Resting ABPI |
|---|---|
| Calcification may be present | >1.4 |
| Probably no arterial disease | >1.0 |
| No significant arterial | 0.81-1.00 |
| disease, or mild/insignificant disease | |
| Moderate disease | 0.5-0.80 |
| Severe disease | <0.5 |
| Critical ischemia | <0.3 |
All the Doppler ultrasounds were performed with TOSHIBA XARIO SSA 660A-V using the 7.5 MHz linear transducer probe by two radiologists. Each subject was placed in prone position with feet hanging over edge of the table. They were studied in neutral position followed by active dorsiflexion and then active plantar flexion of the ankle joint. These maneuvers were performed on each limb separately. Active plantar flexion was conducted against a wall. The angle between the plantar aspect of the foot and the surface of the slab was kept approximately 50–60°, which allowed the subject to reach maximum flexion of the foot during the provocation maneuver. Active dorsiflexion was done to the maximum angle achievable by the subject. PA was studied at knee joint level and PTA was evaluated at the level of medial malleolus. Both arteries were initially evaluated to rule out significant luminal narrowing both in gray scale and color flow. The peak systolic velocity and the waveforms at the neutral position and changes brought about in them by the above-described maneuvers were recorded and analyzed.
RESULTS
A total of 40 limbs, i.e.20 healthy volunteers were enrolled for the study. All the subjects recruited were <30 years old. Male-to-female ratio was 4:1. The youngest person in our study group was 18 years old, while oldest was 29 years old. The mean age was 23.5 years with a standard deviation of 3.7. The popliteal and PTAs were evaluated in all subjects and significant luminal narrowing was ruled out. All vessels had normal course and no anatomic variation was observed. The velocity ranges of all the 40 popliteal arteries in various maneuvers, with median and mean are shown in (Table 3). Mean PSV of the PA in the neutral position is 65.7 cm/s which increased to 69.1 cm/s on dorsiflexion and to 66.7 cm/s in plantar flexion.
| PSV (cm/s) | Neutral | Dorsiflexion | Plantar flexion |
|---|---|---|---|
| Minimum | 33.40 | 42.70 | 35.80 |
| Median | 61 | 68 | 63.75 |
| Maximum | 120.80 | 124.40 | 117.20 |
| Mean | 65.70 | 69.12 | 66.71 |
| Standard deviation | 15.75 | 17.35 | 17.07 |
PSV: Peak systolic velocity
In the neutral position, the 95% confidence interval was between 60.6 and 70.7 cm/s with a standard error of 2.48. On dorsiflexion, the 95% confidence interval changed to lie between 63.5 and 74.6 cm/s with a standard error of 2.74. While on plantar flexion, the 95% confidence interval was between 61.2 and 72.1cm/s with a standard error of 2.69.
Popliteal artery
Waveform
Of total 40 popliteal arteries, 39 showed triphasic waveform (Figure 1a) pattern at rest, while one was biphasic. The changes brought about by dorsiflexion and plantar flexion are shown in (Table 4).
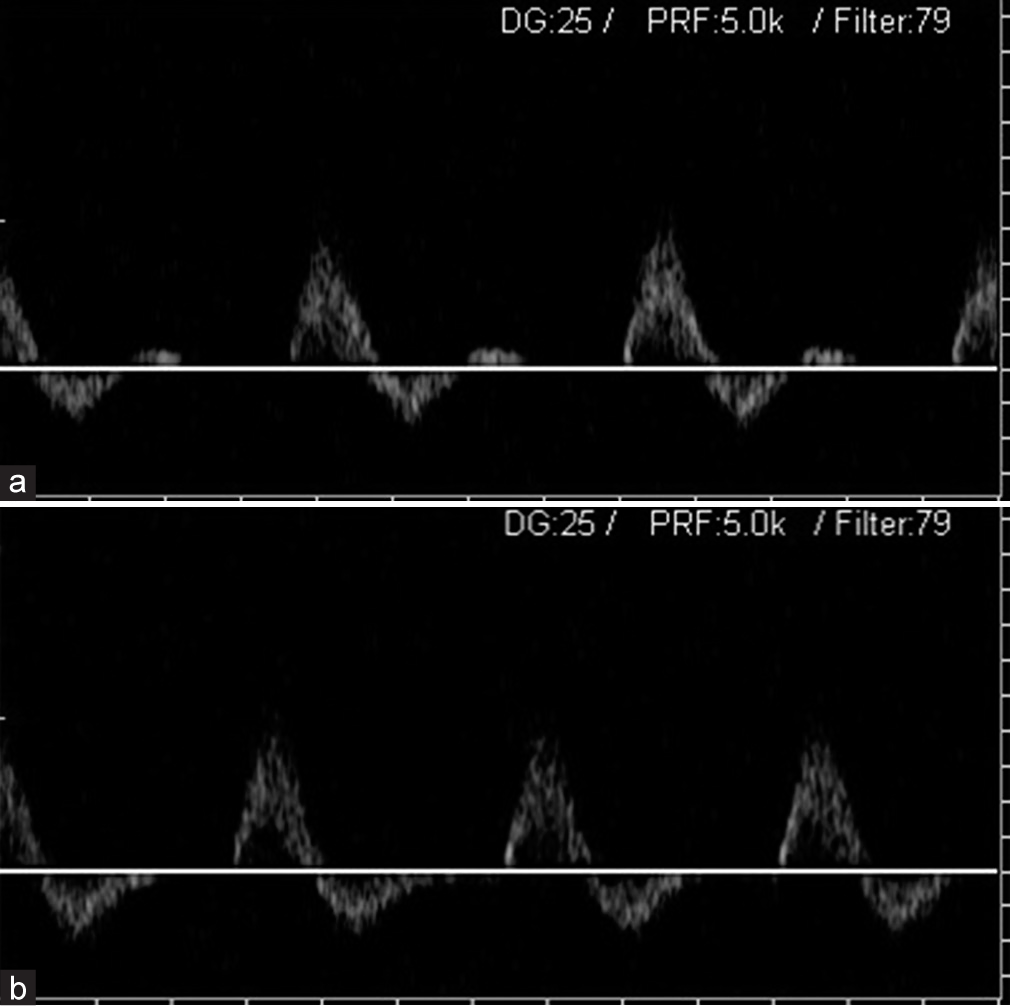
- A 27-year-old male volunteer undergoing Spectral Doppler evaluation of the popliteal artery. (a) Triphasic waveform pattern of the popliteal artery with ankle at the neutral position. (b) Biphasic waveform pattern of the popliteal artery with ankle in dorsiflexion.
| Maneuvers | Triphasic (%) | Biphasic (%) | Monophasic |
|---|---|---|---|
| Dorsiflexion | 21 (53.84) | 18 (46.15) | 0 |
| Plantar flexion | 26 (66.67) | 13 (33.34) | 0 |
On dorsiflexion, out of 39, 21 arteries (53.84%) showed no change in triphasic pattern, while 18 arteries (46.15%) showed a change from triphasic to biphasic pattern (Figure 1b). There were no changes to monophasic waveform.
On plantar flexion, a comparatively greater percentage 26 (66.67%) remained triphasic and 13 (33.34%) changed from triphasic to biphasic. There were no changes to monophasic waveform. One limb which was biphasic to start with did not show any change in its wave characteristics on performing the maneuvers.
Mean change in PA velocity from neutral to dorsiflexion
Eleven popliteal arteries (27.5%) showed decrease in velocity and 27 cases (67.5%) showed increase in velocity from the baseline neutral position velocity (Table 5). Two popliteal arteries (5%) did not show any change in velocity on performing the leg maneuvers.
| Observed | Mean | Standard error | 95% Confidence interval |
|---|---|---|---|
| Decreased (n=11) | 13.90 | 1.89 | 9.69-18.11 |
| Increased (n=27) | 15.04 | 2.16 | 10.60-19.49 |
The mean percentage decrease in velocity was 13.90 with the 95% confidence interval ranging between 9.69 and 18.11. The mean percentage increase in velocity observed was 15.04 with the 95% confidence interval ranging between 10.6 and 19.49.
Mean change in PA velocity from neutral to plantar flexion
Eighteen popliteal arteries (45%) showed decrease in velocity of the PA and 20 (50%) showed increase in the velocity. The remaining 2 arteries (5%) did not show any change in velocity on performing the maneuvers (Table 6).
| Observed | Mean | Standard error | 95% Confidence interval |
|---|---|---|---|
| Decreased (n=18) | 15.68 | 2.66 | 10.06-21.30 |
| Increased (n=20) | 22.00 | 5.74 | 9.98-34.01 |
The mean percentage decrease in velocity was 15.68 with the 95% confidence interval ranging between 21.30 and 10.06. The mean percentage increase in velocity was 22 with the 95% confidence interval ranging between 9.98 and 34.01.
Posterior tibial artery
The mean velocity for PTA was 54.9 cm/s, which increased to 57.6 cm/s and 64.4 cm/s on dorsiflexion and plantar flexion, respectively.
In the neutral position, the 95% confidence interval lies between 46.86 and 63.13 with a standard error of 4. On dorsiflexion, the 95% confidence interval was between 48.9 and 66.4 with a standard error of 4.3. While on plantar flexion, the 95% confidence interval was between 56.00 and 72.8 with a standard error of 4.
At rest, out of total 40 limbs, 28 PTA’s showed triphasic pattern, while seven and five were biphasic and monophasic, respectively. The changes brought about by dorsiflexion and plantar flexion are shown in (Table 7).
| Peak systolic velocity | Neutral | Dorsiflexion | Plantar flexion |
|---|---|---|---|
| Minimum | 16.70 | 19.70 | 29.10 |
| Median | 53.65 | 48.4 | 56.2 |
| Maximum | 146.80 | 134.10 | 136.90 |
| Mean | 55.00 | 57.66 | 64.43 |
| Standard deviation | 25.44 | 27.38 | 26.34 |
Waveform
Twenty eight PTAs were triphasic in neutral position and changes observed with plantar and dorsiflexion are summarized in (Table 8a).
| Maneuvres | Triphasic | Biphasic | Monophasic | Total |
|---|---|---|---|---|
| a: Changes in 28 arteries with leg maneuvers which were triphasic at rest | ||||
| Dorsiflexion | 19 | 7 | 2 | 28 |
| Plantar flexion | 17 | 7 | 4 | 28 |
| b: Changes in five arteries which were biphasic at rest | ||||
| Dorsiflexion | 0 | 5 | 0 | 5 |
| Plantar flexion | 0 | 4 | 1 | 5 |
| c: Changes in seven arteries which were monophasic at rest | ||||
| Dorsiflexion | 2 | 2 | 3 | 7 |
| Plantar flexion | 2 | 2 | 3 | 7 |
On dorsiflexion, 19 (67.8%) arteries remained triphasic, 7 (25%) changed to biphasic pattern, and 2 (7.1%) monophasic. On plantar flexion, 17 (60%) remained triphasic, 7 (25%) became biphasic, and 4 were (14.2%) monophasic.
Five cases which were biphasic in neutral position, on dorsiflexion had no change, all vessels remained biphasic. On plantar flexion, four remained biphasic and one changed to monophasic (Table 8b).
Of the seven cases which were monophasic in neutral position, two became triphasic on dorsiflexion, two changed to biphasic, and three remained monophasic. On plantar flexion, two became triphasic, two were biphasic, and three remained monophasic (Table 8c).
Mean change in PTA velocity from neutral to dorsiflexion
Sixteen arteries (40 %) showed decrease and 22 (55 %) showed increase in velocity. Two PTAs (5 %) did not show any change in velocity on performing the leg maneuvers (Table 9).
| Observed | Mean | Standard error | 95% Confidence interval |
|---|---|---|---|
| Decreased (n=16) | 21.98 | 2.85 | 15.90-28.06 |
| Increased (n=22) | 33.32 | 7.20 | 18.34-48.30 |
The mean percentage decrease in velocity seen was 21.98 with the 95% confidence interval between 28.06 and 15.90. The mean percentage increase in velocity seen was 33.32 with the confidence interval ranging between 18.34 and 48.30.
Mean change in PTA velocity from neutral to plantar flexion
Eight arteries (20%) showed decrease in velocity and 30 (75%) showed increase in velocity. 2 cases (5%) did not show any change in velocity on performing the maneuvers (Table 10).
| Observed | Mean | Standard error | 95% Confidence interval |
|---|---|---|---|
| Decreased (n=8) | 15.87 | 3.74 | 7.01-24.73 |
| Increased (n=30) | 36.78 | 5.61 | 25.31-48.26 |
The mean decrease in velocity was 15.87 with the 95% confidence interval between 24.73 and 7.01. The mean increase in velocity seen was 36.78 with the 95% confidence interval ranging between 25.31 and 48.26. The normal range of blood flow velocities in the popliteal and posterior tibial arteries on performing the provocative maneuvers in our study are as described in (Table 11).
| Maneuvers | Popliteal artery (cm/s) | Posterior tibial artery (cm/s) |
|---|---|---|
| Neutral | 60.66-70.73 | 46.86-63.13 |
| Dorsiflexion | 63.57-74.67 | 48.90-66.41 |
| Plantar flexion | 61.24-72.16 | 56.00-72.85 |
DISCUSSION
Sonographic examination can show arterial compression elicited by maneuvers such as plantar flexion and dorsiflexion of the feet.[3] Even though arterial compression can be shown on sonography, stress maneuvers such as active plantar flexion and passive dorsiflexion of the ankle increase the diagnostic accuracy. Active plantar flexion may cause compression of the entrapped PA by the contracted gastrocnemius muscle, and the entrapped PA may be stretched with passive dorsiflexion.[4,6]
There is limited data currently available in the literature regarding the variations in the velocity and Doppler wave characteristics of popliteal and PTAs, brought about by doing various stress maneuvers at the ankle joint in healthy individuals. We studied this change in velocity and waveforms in popliteal and PTA in 20 healthy volunteers. As PA entrapment is common in young age group,[7] we have selected all of our subjects with age <30 years. In addition to PA, PTA has also been assessed so as to evaluate the distal changes brought about by compression of the PA on performing the maneuvers.
Our study shows that plantar flexion of the foot causes relatively more increase in the mean velocity of PA as compared to dorsiflexion (mean increase of 22 vs. 15 cm/s). None of our subjects demonstrated any loss of blood flow in the artery with plantar flexion. These findings are in contrast to a study conducted by Akkersdijk et al.,[8] in which disappearance of blood flow was seen in up to 59% during active plantar flexion.
Of 38 PTAs, 30 (75%) showed increase in velocity on plantar flexion with mean increase of 36.7 cm/s. On dorsiflexion, 22 arteries (up to 58%) showed increase with a mean increase of 33.3 cm/s.
Typically, in the absence of consensus on ultrasound criteria on a significant increase in velocity, most radiologists use doubling of velocity as the criteria. In our study, none of the volunteers showed doubling of velocity on performing of the maneuvers.
The normal Doppler waveform seen in lower limb arteries is triphasic in appearance.[9] However, we saw significant variations in the triphasic pattern while performing the dorsi- and plantar flexion maneuvers. The changes in waveforms were seen more on dorsiflexion than on plantar flexion in the case of PA and the reverse pattern was seen in PTA.
The most notable change in PA was the change into biphasic form from the originally triphasic wave pattern in 46% of arteries on dorsiflexion. Comparatively on plantar flexion, 33% changed into biphasic from original triphasic and none changed into monophasic. The waveform change to biphasic could likely be attributed to temporary narrowing of the vessel owing to compression by the contracting muscles on performing the stress maneuvers.
In PTA, on dorsiflexion, 25% changed to biphasic and 7% to monophasic, whereas on plantar flexion the change to biphasic was same at 25% with monophasic being at 14%.
In contradiction to the above findings, Miles et al.[10] described normal Doppler waveforms and ankle pressures after active plantar flexion; however, in their study, the subjects had their knee flexed at 60° which reduces muscle tension in the popliteal fossa during exercise. In our study, the knees were kept in full extension throughout the maneuvers.
There are some limitations of our study. Anatomical entrapment of the blood vessel cannot be ruled out completely with Doppler examination and requires cross-sectional imaging like MRI for definite exclusion. Accuracy of the Doppler examination depends on the machine as well as the expertise of the person performing the Doppler. As this is a pilot study, the small sample size may not be representative of the entire population; a large sample data would be needed to validate these results.
Knowledge of the normal range of variation brought about by stress maneuvers on the waveform patterns and blood flow velocities in the popliteal and PTAs helps in preventing overdiagnosis of PAE or occlusion.
CONCLUSION
The change in blood flow velocity is more with plantar flexion on performing different stress maneuvers in the popliteal and PTAs in healthy individuals. Predominantly, a pattern of increase is seen in the mean velocity on plantar flexion and dorsiflexion in both the arteries. The most common change in the Doppler waveforms was the absence of diastolic flow (biphasic pattern). None of the arteries show complete absence of blood flow on these maneuvers.
Our study confirms that waveforms in the popliteal and PTA can even be monophasic depending on the position of the foot in normal healthy individuals; therefore, when biphasic/ monophasic in appearance, they should not be interpreted as abnormal or diseased.
Declaration of patient consent
Institutional Review Board (IRB) permission obtained for the study.
Financial support and sponsorship
Nil.
Conflicts of interest
There are no conflicts of interest.
References
- Popliteal artery compression and force of active plantar flexion in young healthy volunteers. J Vasc Surg. 1997;26:281-7.
- [CrossRef] [Google Scholar]
- Schwartz’s Principles of Surgery. New York: McGraw-Hill Medical; 2011.
- Popliteal artery entrapment syndrome: Role of imaging in the diagnosis. Am J Roentgenol. 2003;181:1259-65.
- [CrossRef] [PubMed] [Google Scholar]
- Popliteal artery entrapment syndrome: Arteriographic findings and thrombolytic therapy. J Vasc Interv Radiol. 1999;10:713-21.
- [CrossRef] [Google Scholar]
- Popliteal vascular compression in a normal population. J Vasc Surg. 1994;20:978-86.
- [CrossRef] [Google Scholar]
- Popliteal artery entrapment syndrome with peripheral thromboembolism. Iran J Radiol. 2008;5:43-6.
- [Google Scholar]
- Popliteal artery entrapment syndrome. Surg Radiol Anat. 1995;17:161-9.
- [CrossRef] [PubMed] [Google Scholar]
- Colour duplex ultrasonographic imaging and provocation of popliteal artery compression. Eur J Vasc Endovasc Surg. 1995;10:342-5.
- [CrossRef] [Google Scholar]
- Introduction to Vascular Ultrasonography (5th ed). Philadelphia, PA: Saunders; 2005. p. :67.
- [CrossRef] [PubMed]
- Doppler ultrasound in the diagnosis of the popliteal artery entrapment syndrome. Br J Surg. 1977;64:883-4.
- [Google Scholar]